Calibration Analysis User Guide
Please read the “Anaysis User Guide” before reading this guide. This guide provides instructions on how to calibrate the performance of either user provided variant effect prediction scores or a system provided VEP.
The steps for running a calibration analysis are similar to those for running a benchmark analysis.
To run a calibration analysis do the following in a python environment, i.e. jupyter lab:
import pandas as pd
from aigct.container import VEBenchmarkContainer

container = VEBenchmarkContainer("<config>/aigct.yaml")

analyzer = container.analyzer

metrics = container.analyzer.compute_calibration_metrics(
    "CANCER", user_vep_scores_df, "UserVep",
    variant_effect_source=None, variant_query_criteria=None,
    pathogenic_fraction_bins=10)
Metrics is an object that contains the results of the calibration analysis. See the the API documentation for the aigct.analyser.VEAnalyzer.compute_calibration_metrics method for a detailed explanation of the parameters passed to that method.
Calibration Analysis Summary
You can view the information stored in the metrics object in various ways. Run the following code to get a high level textual summary:
container.reporter.write_calibration_summary(metrics)
It will generate output similar to the following:
Summary calibration metrics for Variant Effect Prediction Benchmark: 2025/07/21 15:06:41

VEP Analyzed: ALPHAM

Total number of variants in analysis: 572

Binned Scores and Labels

SCORE_RANGE  LEFT_BOUNDARY_EXCLUSIVE  RIGHT_BOUNDARY_INCLUSIVE  MEAN_SCORE  NUM_VARIANTS  NUM_POSITIVE_LABELS  NUM_NEGATIVE_LABELS
-0.00-0.07                -0.000909                  0.066719    0.028976            45                    5                   40
0.07-0.13                 0.066719                  0.133347    0.099937            23                    3                   20
0.13-0.20                 0.133347                  0.199976    0.160158            23                    5                   18
0.20-0.27                 0.199976                  0.266605    0.230557            15                    2                   13
0.27-0.33                 0.266605                  0.333233    0.294272            16                    8                    8
0.33-0.40                 0.333233                  0.399862    0.364605            15                    4                   11
0.40-0.47                 0.399862                  0.466491    0.431856            23                   13                   10
0.47-0.53                 0.466491                  0.533119    0.507449             9                    5                    4
0.53-0.60                 0.533119                  0.599748    0.565044            22                   16                    6
0.60-0.67                 0.599748                  0.666377    0.633018            26                   21                    5
0.67-0.73                 0.666377                  0.733005    0.694051            25                   23                    2
0.73-0.80                 0.733005                  0.799634    0.769641            43                   39                    4
0.80-0.87                 0.799634                  0.866263    0.835255            55                   52                    3
0.87-0.93                 0.866263                  0.932891    0.902392            92                   92                    0
0.93-1.00                 0.932891                  0.999520    0.965103           140                  140                    0
See the the API documentation for the aigct.reporter.VEAnalysisReporter.write_calibration_summary method for a detailed explanation of the parameters passed to that method.
Plot Results
Issue the following to plot the results.
container.plotter.plot_calibration_curves(metrics, 0.9, 0.9, 0.95)
This will generate a series of presentation ready plots and tables:
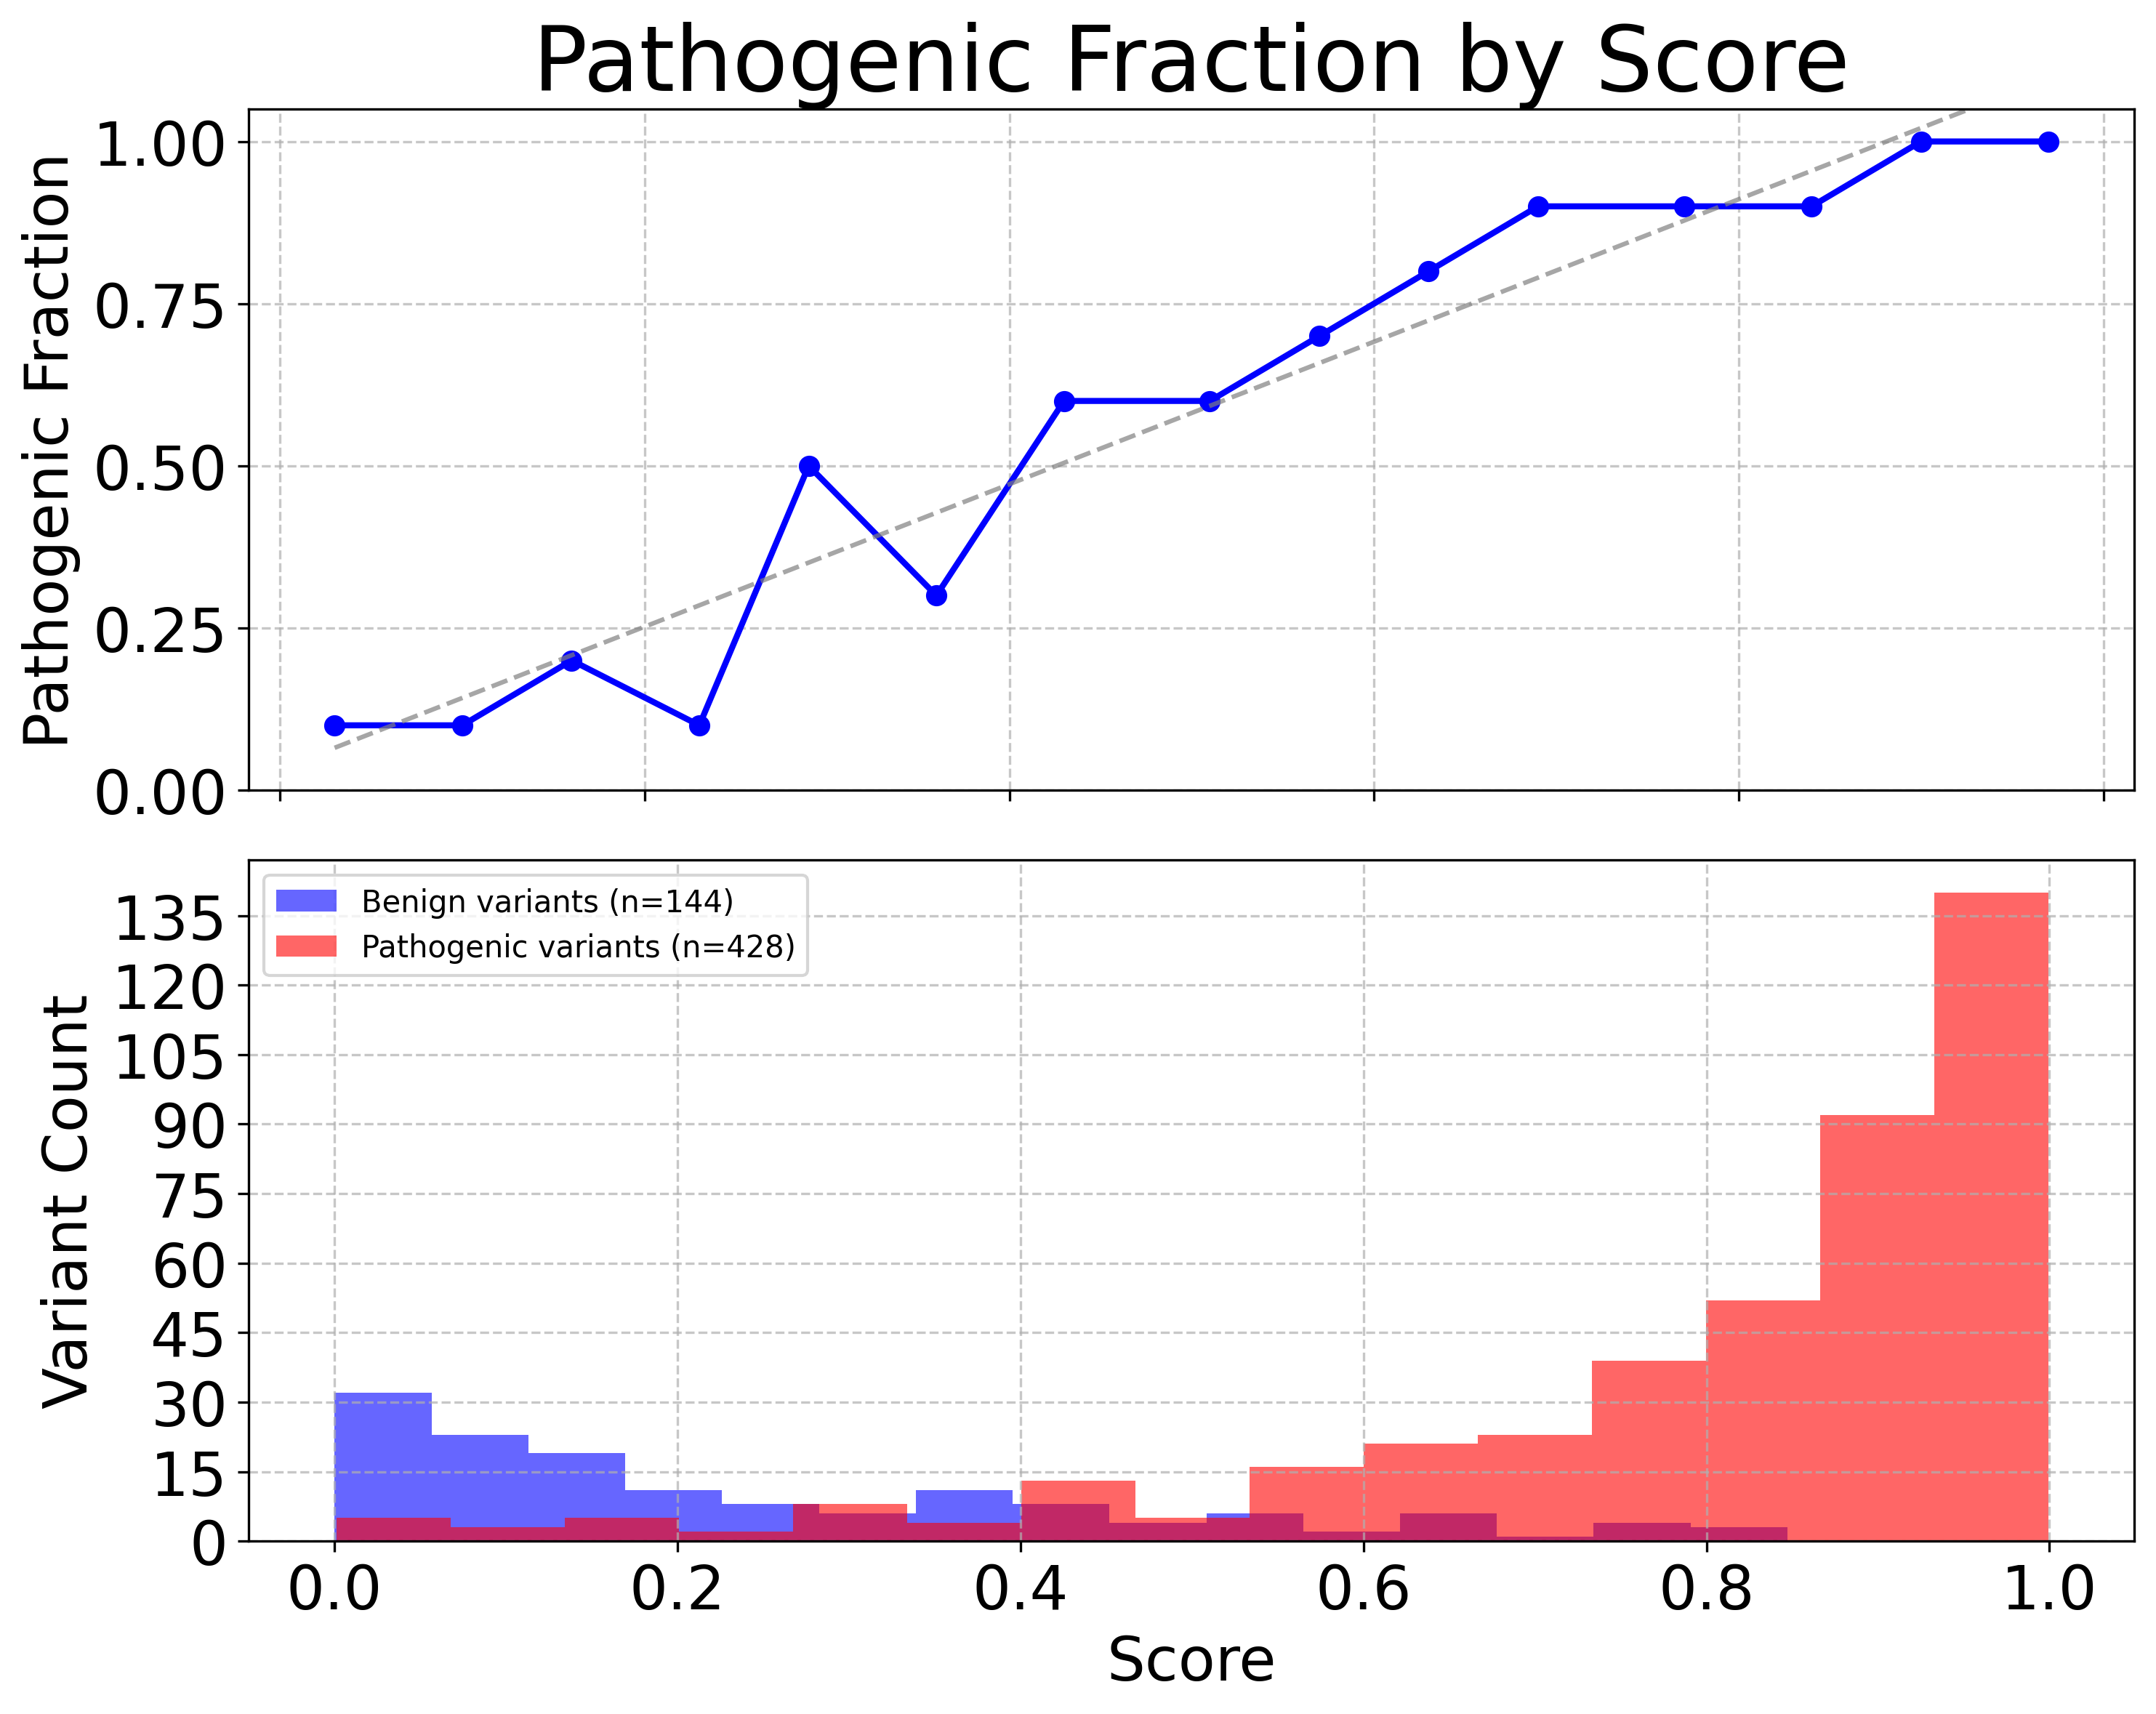
Pathogenic Fraction by score interval
Histogram of variant scores by pathogenicity
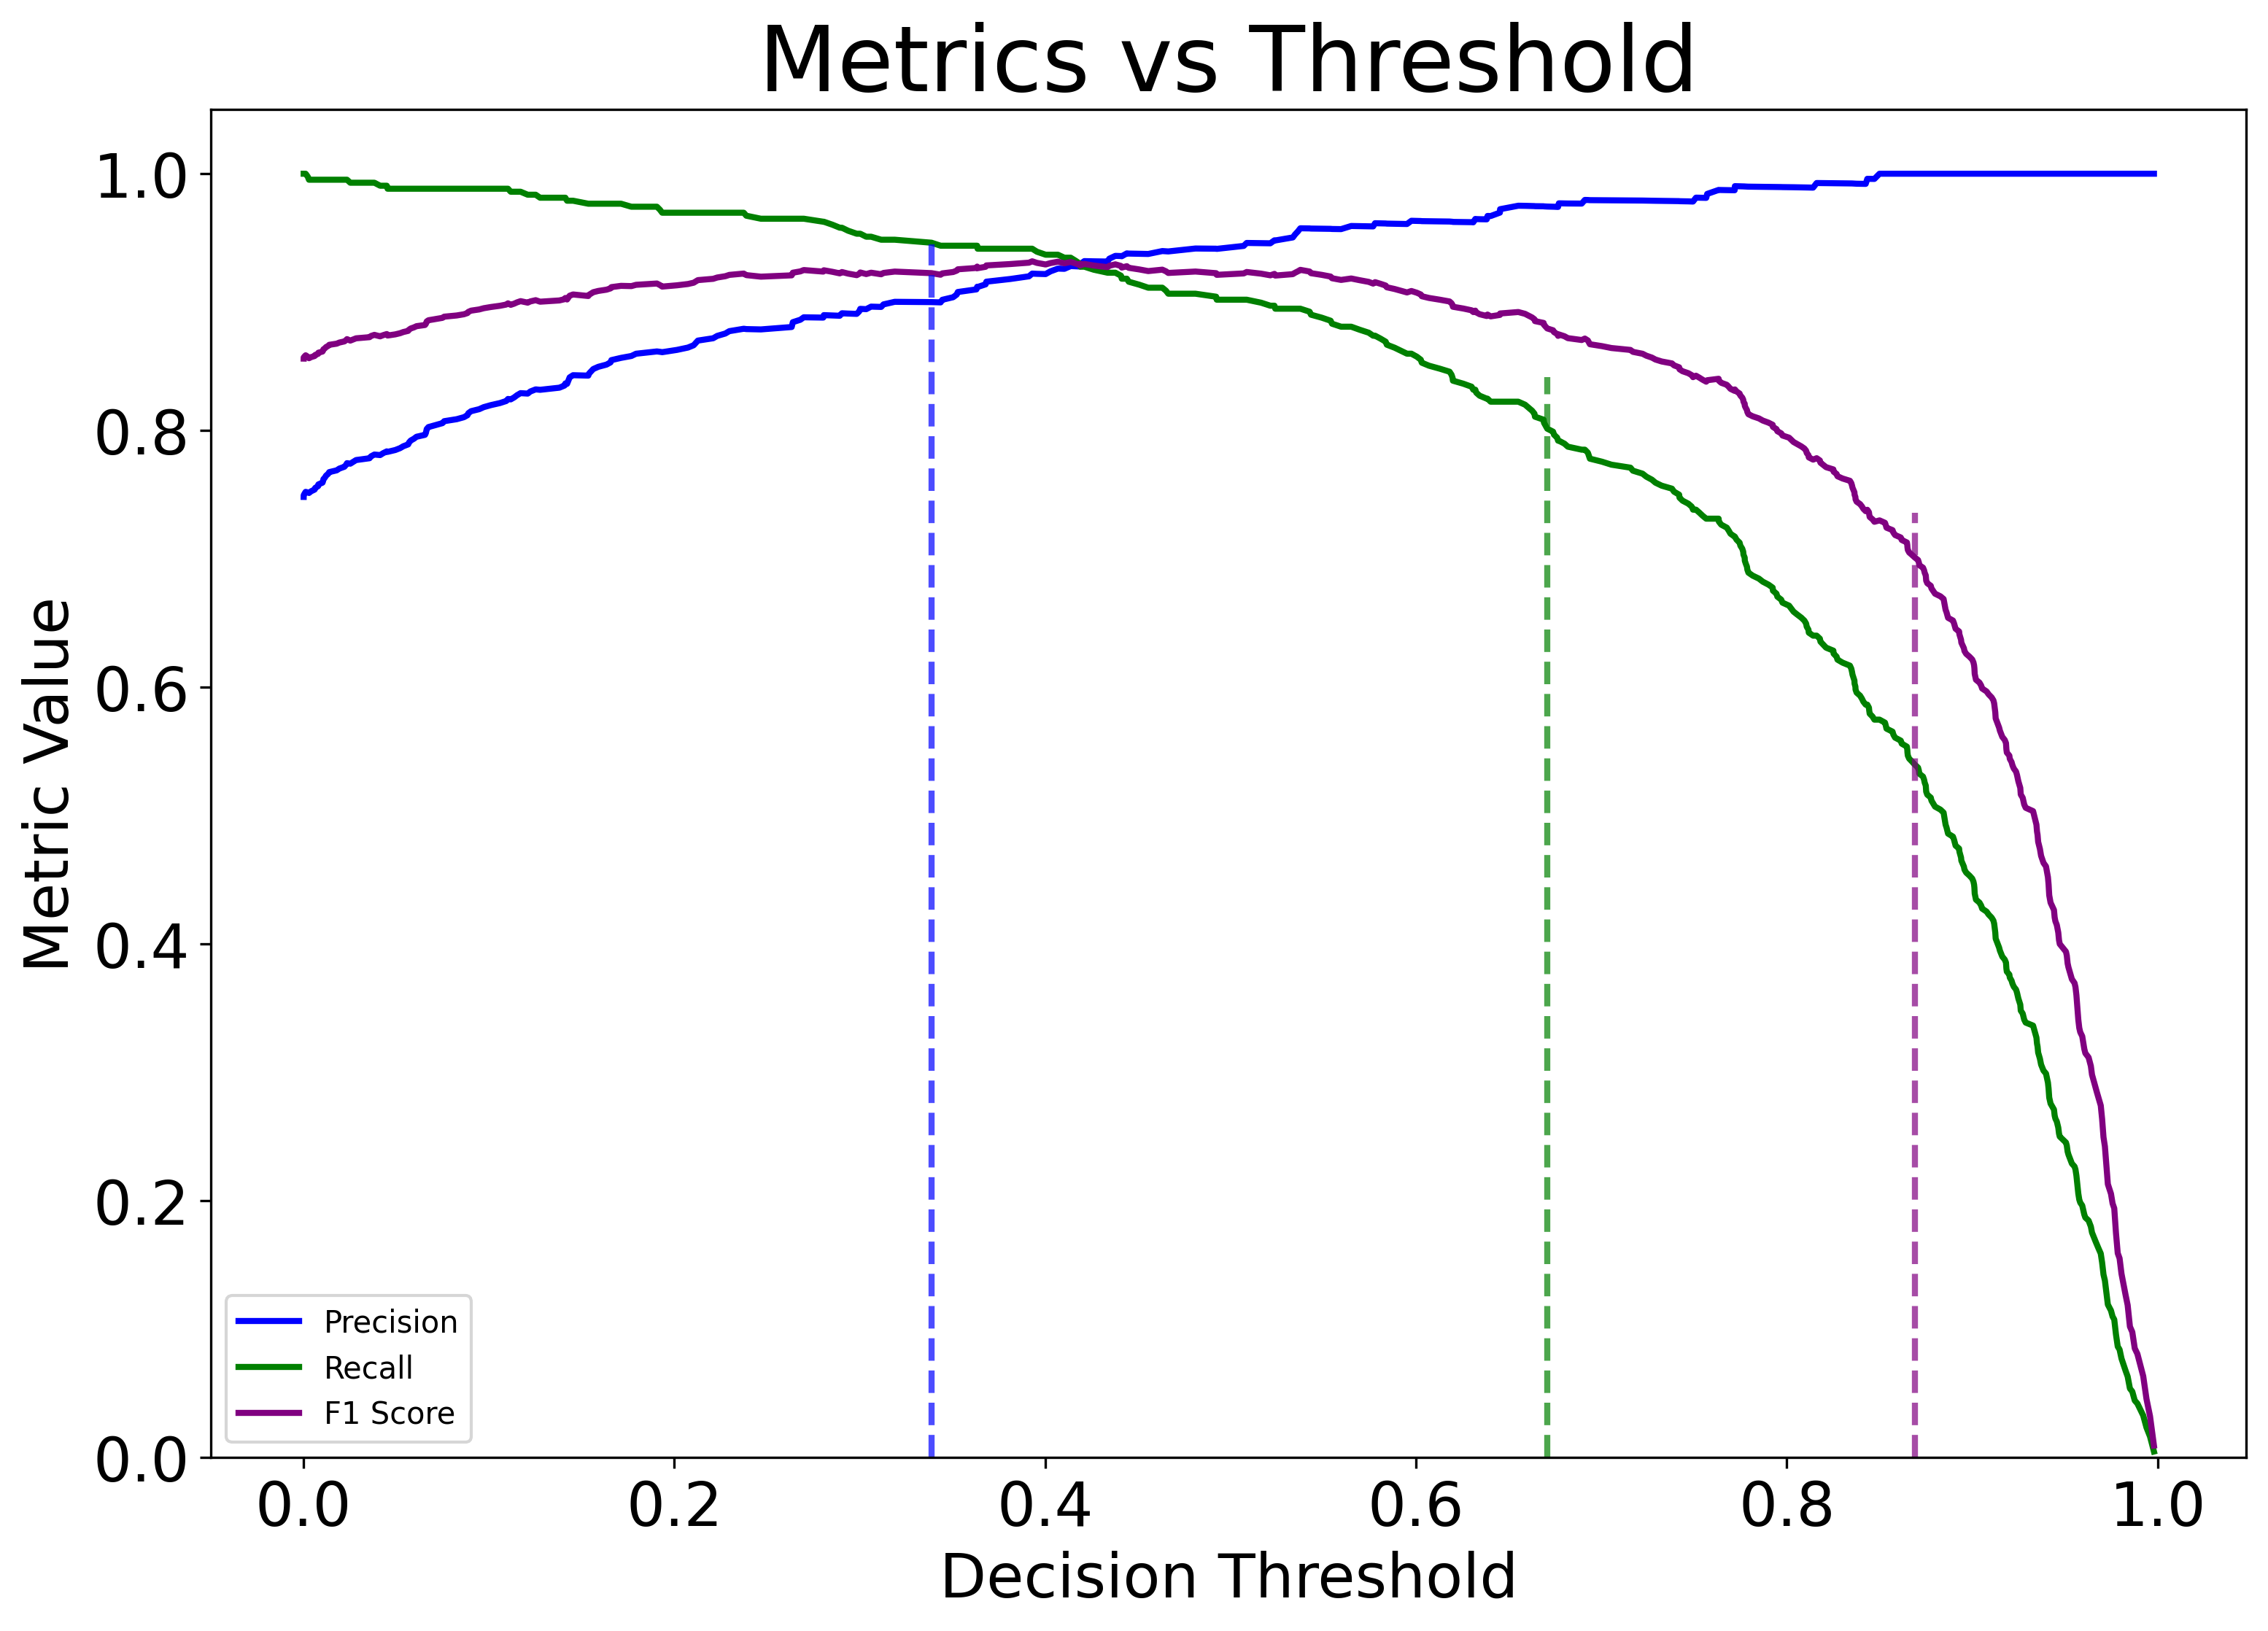
Precision, recall, and F1 score versus threshold values
Here is an example of some of the plots generated:
See the the API documentation for the aigct.plotter.VEAnalysisPlotter.plot_calibration_curves method for more details.
Export Results
Issue the following to export the raw calibration analysis result data underlying the plots and tables to csv files that can be used to produce your own plots or to do further analysis.
container.exporter.export_calibration_results(metrics, “<export_dir>”)
The second parameter is the name of a directory where you want the results to be exported. It will generate a series of files in a uniquely named subdirectory of this directory.
See the the API documentation for the aigct.exporter.VEAnalysisExporter.export_calibration_results method for more details.